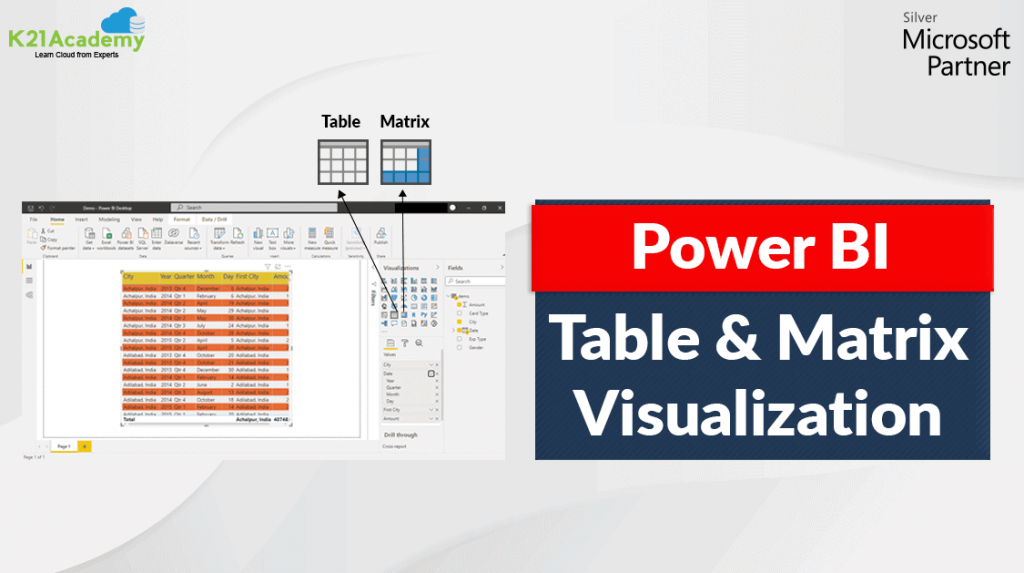
𝐓𝐚𝐛𝐥𝐞 𝐚𝐧𝐝 𝐌𝐚𝐭𝐫𝐢𝐱 𝐕𝐢𝐬𝐮𝐚𝐥𝐢𝐳𝐚𝐭𝐢𝐨𝐧 𝐢𝐧 𝐏𝐨𝐰𝐞𝐫 𝐁𝐈
📌 𝐏𝐨𝐰𝐞𝐫 𝐁𝐈 is an excellent tool for graphical visualizations and the table and matrix visualization helps to display categorical variables with text labels in the report.
🚠 𝐓𝐚𝐛𝐥𝐞 𝐕𝐢𝐬𝐮𝐚𝐥𝐢𝐳𝐚𝐭𝐢𝐨𝐧 ➪ It consist of related data stored in rows and columns. Users can create tables in reports and cross highlight elements within the table.
📄 𝐌𝐚𝐭𝐫𝐢𝐱 𝐕𝐢𝐬𝐮𝐚𝐥𝐢𝐳𝐚𝐭𝐢𝐨𝐧 ➪ Matrix Visualization in Power BI is somewhat similar to table visualization. In table visualization, we represent data in two-dimensional way. Whereas in matrix visualization, data is represented in three-dimensional way.
𝗦𝗼𝘂𝗻𝗱𝘀 Interesting? 🤔 Want to know more about Table and Matrix Visualization in Power BI❓ 👉 Check out the blog at https://k21academy.com/da10031 which covers:
➽ What is Table Visualization?
➽ What is Matrix Visualization?
➽ Load Data into Power BI
➽ Create Power BI Table Visualization
➽ Create Power BI Matrix Visualization
➽ Difference between Table and Matrix Visualization
➽ Conclusion
If you are planning to become Microsoft Data Analyst Certified, then join the FREE CLASS now at https://k21academy.com/da10002
About the Author Atul Kumar
Oracle ACE, Author, Speaker and Founder of K21 Technologies & K21 Academy : Specialising in Design, Implement, and Trainings.

