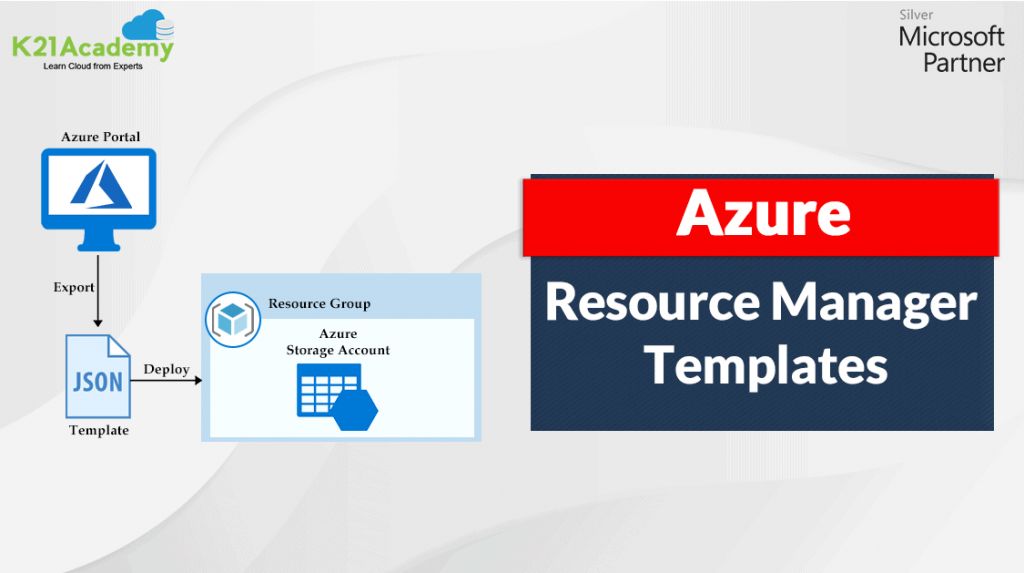
Introduction to ARM Templates: Learn, Create and Deploy in Azure
An ARM template is a block of code that defines the infrastructure and configuration for your project. It uses a […]
An ARM template is a block of code that defines the infrastructure and configuration for your project. It uses a […]
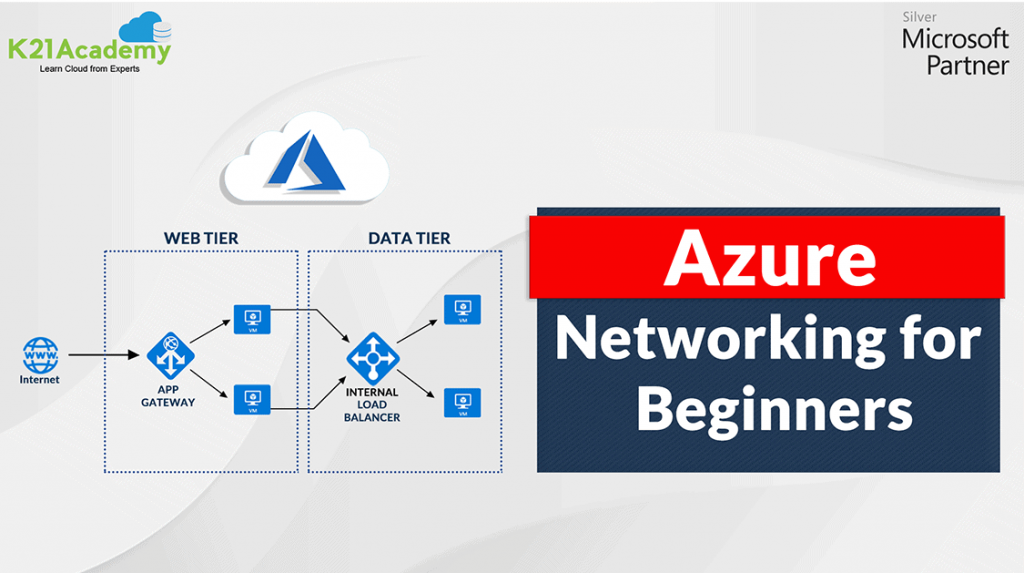
Azure Networking is a communication protocol for connecting multiple resources via the Internet. Azure provides various tools and services that
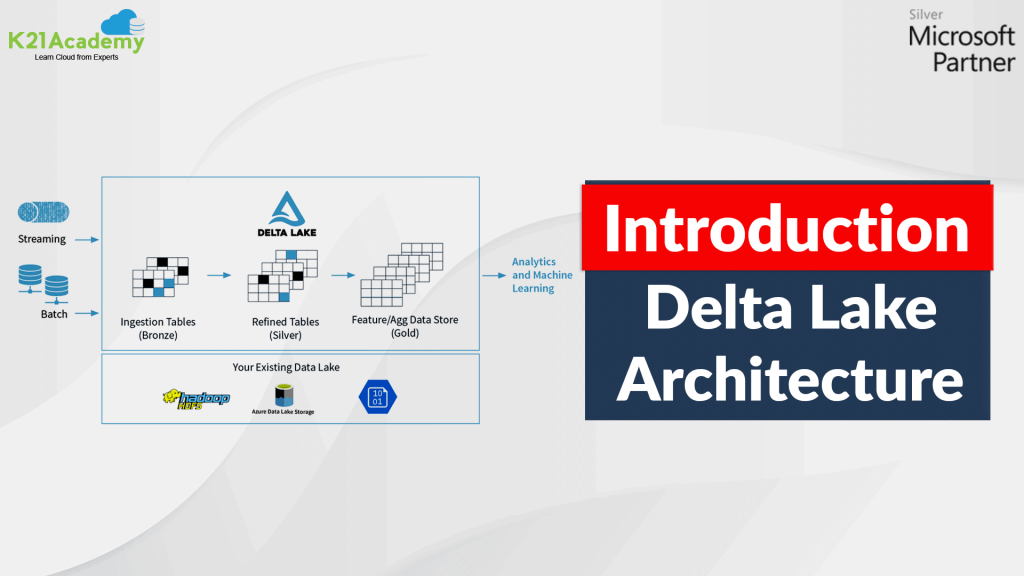
📍 Delta Lake is an open-source storage layer that brings ACID (atomicity, consistency, isolation, and durability) transactions to Apache Spark
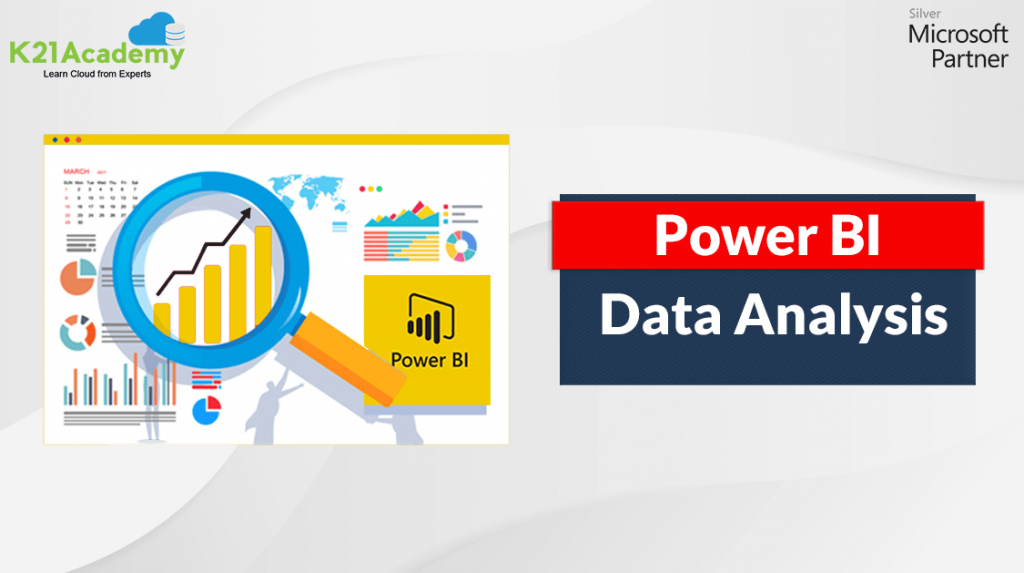
Data Analysis is necessary to turn raw data into valuable insights. Analyzing data helps to generate more leads and

Paginated Reports are special kinds of reports that can be designed from scratch using charts, graphs, syntax, and expressions
This blog post will discuss the summary of all the questions that were asked in our Microsoft Azure Data Fundamentals
This blog post will give a quick insight into our Microsoft Azure Data Fundamentals [DP-900] Free Class (Day 1) on
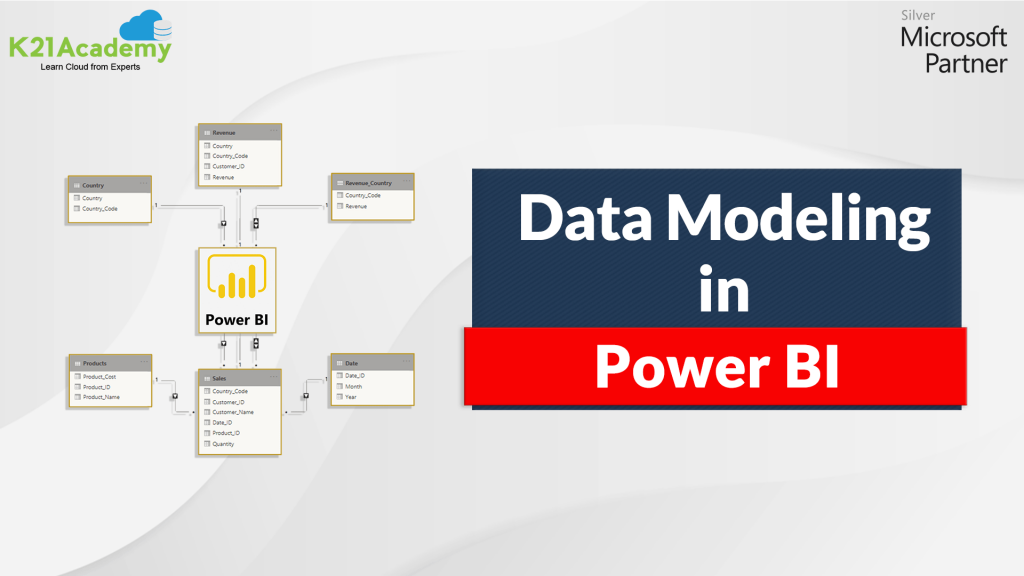
> Power BI Power BI is a business intelligence and analytics tool that turns data into insights. It is used
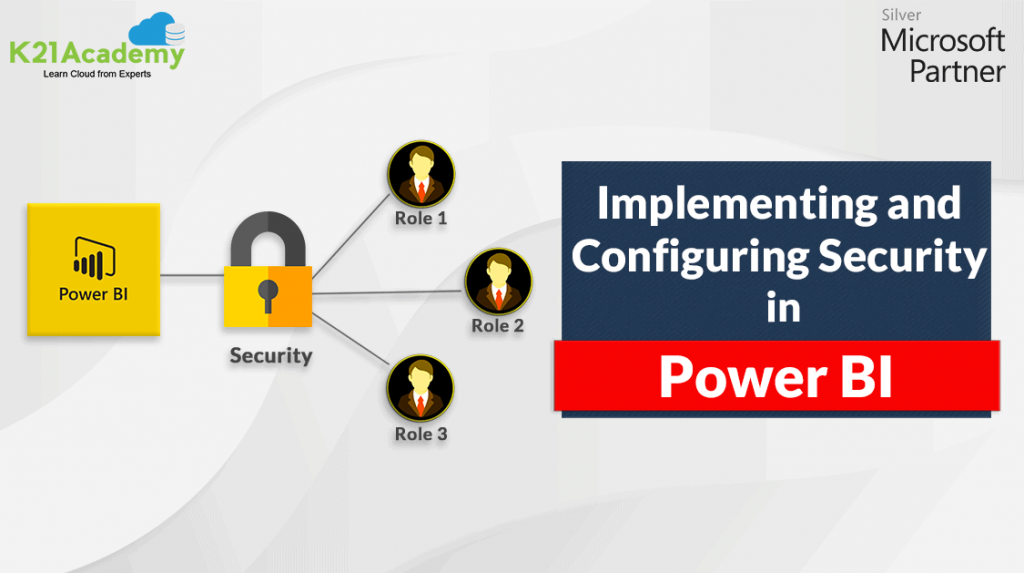
> Power BI Power BI is a business intelligence and analytics tool that turns data into insights. It is used

Power BI Report Power BI report is the tool that helps in visualizing the data from a multi-perspective view