In today’s post I am going to Monitoring WebLogic Server Transactions from topic Transactions for WebLogic 12c Certification 1Z0-133 for Administrators . If you have come directly on this post then first check first check
- WebLogic Server’s role in managing transactions
- Configure WebLogic Server transactions (JTA)
- Configure the WebLogic Server default store used for transaction logs
- Configure Database persistent store for TLogs
1. Monitoring of Transactions is configured at Server Level, go to Servers -> [ServerName] -> Monitoring -> JTA
2. On Summary sub tab of JTA, you will see
a) Transaction Total Count
b) Transaction Committed Total Count : since re-start
c) Transaction Rolled Back Total Count : since re-start
d) Transaction Rolled Back for Timeout Total Count
etc
3. To view transactional monitoring of a particular resource, go to Servers -> [ServerName] -> Monitoring -> JTA -> [Select Resource]
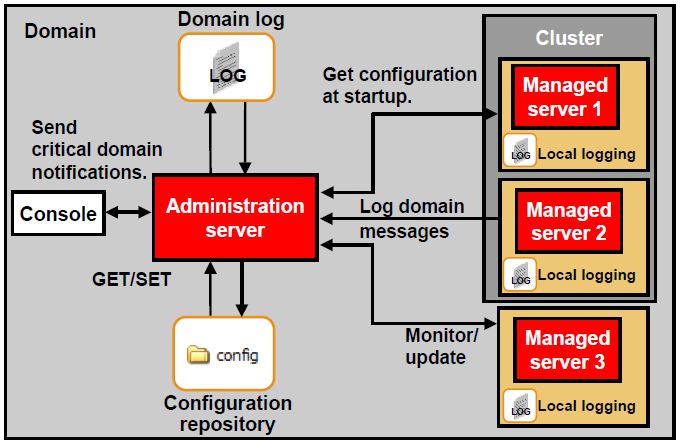
4. If message during Transaction is recorded then you can view it in Server’s log $DOMAIN_HOME/servers/[name of Server]/logs
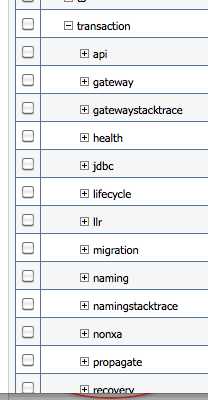
5. You can turn transaction debug flag for detailed transaction log messages go to Servers -> [ServerName] -> Debug-> expand Weblogic -> expand Transaction
Learn Oracle Weblogic Server Administration
Get 100 USD OFF + 100% Money Back Guarantee


Comments are closed.